
Giancarlo Stanton is a monster. Over the past five years he’s been one of the most dangerous hitters in baseball, one of the most valuable players overall, and one of the best young hitters that the game has ever seen. He’s also missed more than 20% of his team’s games and has been injured in four of his five full seasons in the major leagues (and that’s not counting his gut-wrenching, freak facial injury). His injury history calls to mind another recent superstar, the Rockies-come-Blue Jays’ shortstop, Troy Tulowitzki – is there a common pattern, and just how much value does a team lose when their superstar only suits up for 75% of their games?


There’s something of a perception that Stanton’s injury history is full of “freak” injuries like the gruesome beanball he took in 2014, but it really isn’t. Stanton only missed 17 team games that season and was back in action on opening day the next year.
Excluding that injury, in his five full season in the majors (2011-2015), Stanton has missed 178 games to injury. He lost 11 to hamstring and quad injuries in 2011, 36 games to knee surgery & abdominal strain in 2012, Hamstring and shoulder injuries cost him 44 games in 2013, and he lost 87 games in 2015 to a hand fracture suffered during a bat swing. That’s an injury prone player.
It’s also irrelevant as to whether you want him on your roster, because even with all those injuries he’s still 15th in fWARWins Above Replacement as calculated by FanGraphs. A stat that attempts to measure a player’s contributions in all facets of the game and quantify how many more wins that player contributed than a “replacement level” player would have (a replacement level player being a hypothetical “AAAA player” every team has in its farm system. among position players over those seasons. When he’s been in the lineup, he’s easily a top-10 hitter, posting a 149 wRC+Weighted Runs Created Plus: A comprehensive measure of offensive production relative to the league. 100 is average and each point above or below is a percentage better or worse than the average player. (6th in MLB). It’s frustrating to watch a player of his caliber struggle to stay on the field; fans certainly want to see him play and his team (the Marlins, at least until he opts out in 2020) clearly wants their superstar in the lineup. That said, just how much value does a team lose with a player who misses games like Stanton?
The 125-Game All-Star
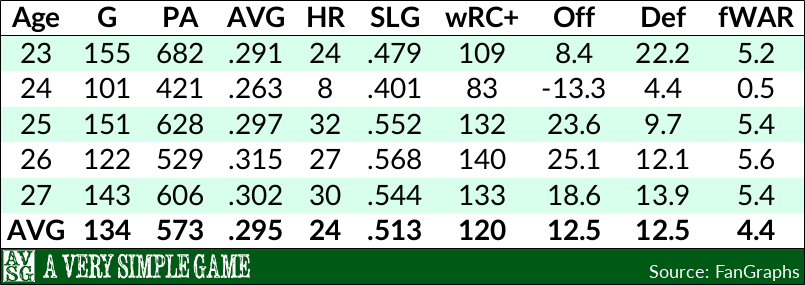
Here are Giancarlo Stanton’s totals for his first five seasons in the Major Leagues (i.e., excluding his rookie year in 2010).

Two things immediately stand out. One, just how good he was so young. Only two other players hit more home runs in their age-21 & age-22 seasons: Eddie Mathews and Joe DiMaggio. He’s 19th all time in wRC+ for those seasons, two spots behind Hank Aaron and two spots ahead of Ken Griffey Jr. He’s been very good. The other thing to stand out is just how much time he’s missed.
 If we generously define a “full season” as 145+ games, he’s only hit that mark twice. He’s averaged only 122 games per season and just over 512 plate appearances. If the average young starter plays 155 games per year and gets 650 plate appearances (Stanton’s averaged 4.21 PA per game), then Stanton’s missed 21.2% of his “expected” playing time.
As we mentioned in the lede, there’s another young (well, formerly young) superstar in recent history who’s missed a good chunk of his expected time: Troy Tulowitzki. Here are Tulo’s first five full seasons in the majors.
While they definitely aren’t the same player, there are a few parallels between the two. Tulo managed only two “full” seasons as well (falling just short of a third), and the two of them both averaged about 4.5 fWAR per year. That said, Tulo played in about 10% more games than Stanton, and his performance was balanced between both offense and defense (measured by OFFOffensive Runs Above Average. A stat that attempts to measure a player’s offensive contributions, combining both hitting and base running. Roughly 9-10 OFF is equal to one Win Above Replacement. and DEFDefensive Runs Above Average. A stat that attempts to measure a player’s defensive contributions, including a positional adjustment (i.e., a shortstop is considered more defensively valuable than a LF). Roughly 9-10 DEF is equal to one Win Above Replacement.), whereas Stanton provides most of his value at the plate. Also, Tulowitzki was, other than his off season at age 24, more consistent, providing between 5.2 and 5.6 fWAR in four of five years.
 Of course, any team out there would gladly slot a 4.5 WAR player into their lineup, but there still is a bit of a “what might have been” with both of these players. On a per plate appearance basis, Tulo has produced the 64th most WAR in MLB history. He’s in the middle of players like Chipper Jones (56th), Roberto Clemente (60th), Duke Snider (65th), and Al Kaline (70th). Now, that’s the career rate for all those guys, so it accounts for their decline years, but it’s clear he’s in good company. However, on a per season basis even those first five seasons (i.e., his best) he’s more in the mix with Nomar Garciaparra (139th) and Hanley Ramirez (142); good players, but it’s the difference between buying a ticket to Cooperstown and having your name on a plaque.
The effect is even larger with Stanton. On a per plate appearance rate he’s in the top-50, sandwiched between guys like Wade Boggs, Jeff Bagwell, and Mike Piazza. On a per season basis he’s with Tulo, nearly 100 spots lower, with Carlos Beltran and Kenny Lofton. Will Stanton change the pattern and start logging 150-game seasons? No way to tell, but generally players don’t get more durable as they get older. Hopefully the completely anecdotal and utterly unscientific example of Tulowitzki isn’t a model, as his four more recent seasons show a distinctly negative trend.

The past four years he’s only managed to break 100 games half the time, and he’s averaged under 100 games and just over 400 PA per season. When he’s been good, he’s been very good, but he’s still averaged one fewer WAR per season. That puts his recent per season performance into Chuck Knoblauch and Jeff Cirillo territory – good, but not quite what the Rockies or Jays were/are hoping for for $20m per year.
How much does that missed playing time cost a team? That’s actually a good question. In simplest terms, just figure out the WAR that the player “would have” produced if they’d played and then multiply by the going cost of a WAR on the open market (between $7-8m, depending on whose numbers you use). So when Stanton puts up 3.8 WAR in only 74 games, figure that the Marlins lost out on 3-4 WAR in the other 74 he missed. That’s $21-32m worth of value they didn’t get. You can decide for yourself whether the fact Stanton was only paid $6.5m last season makes that loss easier or harder to accept (it’s like damaging something you bought on sale – is the loss worse because you’ll never replace it at the price you originally paid?).
 On average, Stanton has missed 21% of his plate appearances, so the Marlins have missed out on roughly 1 WAR per season, or $7-9m in value. Now, in terms of team performance (which in the case of the Marlins, you could make a compelling argument that the ownership doesn’t actually care about in the slightest), it’s not quite so simple. Obviously a team misses out on the production when a player is out of the line up, but that lineup spot doesn’t stay empty, so they gain the performance of another (notably lesser) player. In the case of Stanton, he’s getting replaced by a 4th outfielder, i.e., a guy not quite good enough to land a starting spot.
Over the past five seasons, a National League average production for outfielders has been 0.34 WAR/100 PA – roughly 40% as productive as Stanton has. If the Marlins were lucky enough to have a league average outfielder on their bench (definitely not a given), they’d have gotten around 2.3 WAR in the games Stanton missed, instead of the 5.8 he projects to have produced, had he played. That’s roughly 3.5 WAR they missed over those five seasons, between $25-30m worth of production. In today’s baseball economy, that may not be a lot (at least to some teams), but it sure ain’t nothing (especially to some teams).